Despite record stock market highs, low employment and some positive sales momentum in recent quarters, the full-service restaurant industry still struggles with some significant challenges.
For one, while wages have improved a bit, they haven’t been increasing at a significant level, which continues to hamper consumer spending. Rising interest rates and a softening housing market has made many households more conservative about dining out.
The low unemployment rate makes it difficult for restaurants to recruit and retain employees, which has an affect on costs, service levels and guest satisfaction. Competition from fast-casual operators and home delivery, not to mention meal-kit services, are also taking a bite out of full-service restaurant traffic.
 What does all this mean for beverage-alcohol consumption on-premise? It’s fallen 1.1% in total to 1.7 million cases in 2017, according to the Beverage Information Group’s 2018 Cheers On-Premise Handbook, released in November.
Much of that is due to the 1.6% decrease in cases of beer sold on-premise, while wine was up just 0.5%. Spirits continues to be the bright spot, increasing 3.5% in 2017, down only slightly from the 3.7% increase the segment saw in 2016.
Retail dollar sales of beverage alcohol on-premise increased a bit in 2017, with spirits showing 8% growth, wine rising 2.2% and beer up 3.2% over 2016. This is an indicator of the continuing “premiumization” trend: Guests may be having fewer drinks, but they’re trading up to premium brands.
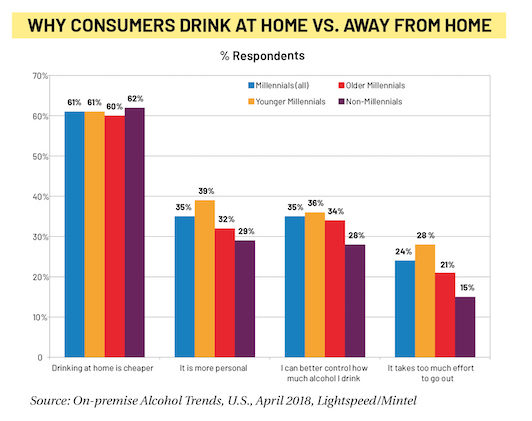
The allure of at-home consumption
A recent Lightspeed/Mintel survey reveals a 3% net decrease in total on-premise alcohol consumption. The main reason consumers say that they drink at home is that it cost less vs. a bar or restaurant. But younger Millennials in particular prefer imbibing at home for a number of other reasons.
People aren’t just drinking more at home vs. away from home. Research firm the NPD Group reports that U.S. consumers are increasingly eating and preparing their meals at home. More than 80% of meals were prepared and eaten in home in 2017.
While foodservice spending was up 2% for the year ended May 2018, NPD Group says that foodservice visits were flat during the period compared to year ago. Spending was up because the cost of a restaurant meal is increasing faster than the cost of a meal prepared at home.
Consumers today have fewer reasons to ever leave the house at all, from more people working from home to online shopping to food and alcohol delivery to streaming entertainment. But that can pose an opportunity for on-premise operators, as consumers may need to seek ways to connect with others.
Education is one way to entice people in, as more consumers have become interested in beverage alcohol categories from bourbon and rye to natural wine and the vast iterations of IPAs. They want to learn from the experts and connect with people who share their passion.
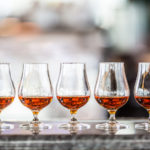
Flights right
Tasting flights are a good way for on-premise operators to engage customers. According to the Cheers/Beverage Information Group 2018 On-premise Survey, of those respondents that say they offer flights, more than half (51%) offer beer flights, while 44% offer spirit flights and 31% offer wine flights. The interest in craft and imported beer and the proliferation of local brews and unique styles is no doubt driving beer flights.
It’s interesting that more respondents offer spirits flights than wine flights, considering the concept of tasting flights came from the wine world. But then spirit education is huge on-premise. Spirits flights most often offered by respondents include bourbon, Scotch and other whiskeys and tequila.
Another way to connect with guests is to be able to recommend a beverage depending on their taste preferences and mood. The plurality of our respondents (54%) say that server recommendations drive drink-order decisions for undecided guests, while 34% say that the drink description on the menu is what spurs the choice.
How else to get consumers to go out for a meal or a drink? Guests are looking for new products and flavors—beverages that they haven’t had before or that would not be easy to replicate at home.
Younger consumers are particularly open to trying new things. The Mintel survey finds that Millennials are interested in drinks such as fruit-flavored beer and non-apple cider, as well as imported beer—namely European and Mexican.
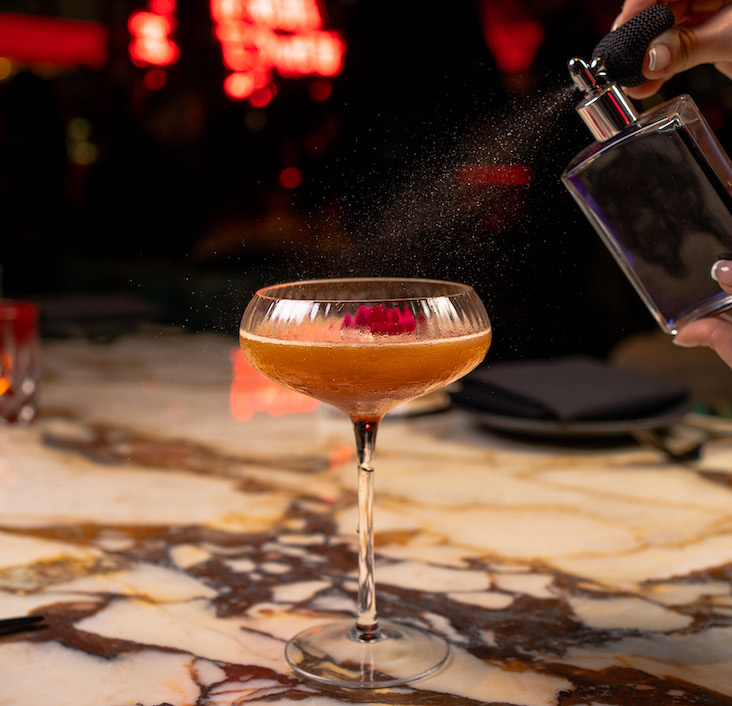
Top cocktails and shots
As it has been in most recent years, the Margarita is still the most popular cocktail, among respondents to the Cheers/Beverage Information Group 2018 On-premise Survey, with 17% ranking it first. Many operators opt to put local, seasonal or premium spins on the drink. For example, several operators surveyed offer barrel-aged Margaritas.
The second most popular drink is pretty much anything—club soda, tonic, fruit juice—mixed with vodka. In the age of craft and classic cocktails, new and rediscovered spirits and modern mixology recipes and techniques, the top-selling drink at many establishments is a Vodka and Soda and the like. “Sad but true,” commented one survey respondent.
The Old Fashioned has been gaining steam in recent years. While it’s number three in our survey, with 8.3% of respondents saying that it’s the most popular, it ranks higher at many establishments, especially those with a craft cocktail focus.
The Martini (all types, including fruit and dessert flavors) and the Mule tied for fourth place. As with the Margarita, many bars and restaurants offer updates and twists on the traditional Moscow Mule vodka cocktail.
The Manhattan rounds out the top five, demonstrating the popularity of whiskey and interest in Old-school cocktails. Whiskey/bourbon cocktails combined with Coke and other sweet mixers were also popular among respondents.
Not many rum cocktails made the list, but there are always some calls for Mojitos and Mai Tais. Long Island Ice Teas, with a little bit of everything spirit-wise, also continue to be popular on-premise.
Fireball cinnamon whisky is the most-popular shot among survey respondents. The flavored whisky’s sweet/spicy profile appeals to Millennials and other younger legal-age drinkers.
Tequila shots (any brand) are the second most popular, followed by Jameson Irish whiskey, Patron tequila and Jack Daniel’s. Outside of the top five, Jagermeister and Lemon Drops were also popular shot calls.
Spirited brands
Bacardi is the overall leading call brand among respondents to the Cheers/Beverage Information Group 2018 On-premise Survey. The rum giant so dominated the rum category, with 48% of respondents listing it as the top rum call brand, that the rest of the list was highly fragmented. But Captain Morgan, Sailor Jerry and Mount Gay were mentioned as some of the top rum call brands.
Tito’s vodka and Patron tequila tied for second place on the list of overall top call brands, followed by Tanqueray gin, Captain Morgan and Jack Daniel’s to round out the top five. It’s interesting that the top-10 list of brands included four gins, considering the category’s consumption numbers in recent years have been lagging.
The top-five brands in the whiskey category are primarily American, with one Canadian (number-two Crown Royal) and one Irish whiskey (number-four Jameson). There are no Scotch brands represented in the top five, although Glenlivet is among the top 10. The other top-10 brands are all bourbons.
Tito’s is on fire. Not only is it the top vodka call brand and second most-popular overall call brand, it’s the fastest-growing spirit brand among respondents. The Texas vodka brand, which celebrated 21 years in business in 2018, has captivated many consumers with its homegrown story and high quality-for-value ratio.
Fireball cinnamon whisky and another Texas vodka, Deep Eddy, ranked highly as fast-growing brands. With the proliferation of local distilleries and regional specialties, the list of fast-growing brands quickly becomes fragmented.
 Given all the different spirit brands available, it’s not easy for bars and restaurants to decide how many to carry and which ones. But five to 10 brands seems to be the magic number for the leading spirit categories.
For instance, 44% of respondents say that they carry five to 10 vodka brands, while 40% offer that many whiskey brands. It’s worth noting that 14% of respondents say they carry more than 21 brands of whiskey, while just 3% say that they carry more than 21 brands of vodka.
The plurality of respondents say that they stock less that five brands for rum (57%), gin (66%) and tequila (46%). The cordials category was somewhat more evenly distributed; about 26% offer more than 16 brands. This makes sense considering how many different types, flavors and brands of cordials are available, plus bartenders need a wide variety as cocktail modifiers.
A taste of on-premise wine trends
Given all the excitement and promotion about rosé, it’s no surprise that the plurality of survey respondents (13.3%) say that the pink wine is the fastest growing style or varietal. U.S. consumers have embraced the drier styles of rosé, particularly during warmer weather. It also doesn’t hurt that chilled glasses of rosé make for popular Instagram posts.
Cabernet sauvignon was the next most-popular wine, with 11.5% of respondents rating it the fastest growing, followed by a three-way tie for third: chardonnay, pinot grigio and pinot noir—each with 10.9%. Sauvignon blanc, malbec and moscato tied for fourth with 7.9%, while merlot rounds out the top-five with 6.1% of respondents saying that it’s the most-popular style or varietal. Among the “Other” responses, red blends are showing strength.
When it comes to wines by the glass, the plurality of survey respondents (42.8%) say that they offer five to 10 wines by the glass. A few more say they offer 11 to 15 wines by the glass (18.7%) than those that offer less than five (17.9%), and a surprising number (8.4%) offer more than 21 wines by the glass.
By-the-glass wine programs have come a long way in recent years. For one thing, technology that preserves wine in bottles that have been opened, such as Coravin, has enabled bars and restaurants to improve their by-the-glass selections.
Alternative packaging for wines, such as kegs and boxes, have also made by-the-glass programs more cost effective, particularly since there are now higher-quality wines available in these formats. Still, just about 7% of survey respondents say that they offer wine on tap, although 9% are considering offering it.
More than half (54% of respondents) say they don’t offer alternative wine formats beyond wine by the bottle or glass. Among those that do, splits are the most popular; 26% say they offer them. This is likely driven by the growth in sparking wine, since splits keep the wine fresh and bubbly; they’re also fun for guests.
Half-bottles are the next most popular alternative wine format, offered by 17% of survey respondents, followed by cans and magnums, each offered by roughly 5%. Some operators like to offer magnums and other large-format bottles for the “wow” factor. Guests frequently take photos of the bottles and post them on social media, so it draws attention to the bar, restaurant or club.
On-premise guests are motivated by cost with wines, as 37% say that price/value is the key driver behind customer wine selections. A wine’s availability by the glass was a key driver for a quarter of the respondents, while 17% said it is server recommendation and 12% say it is brand recognition. Just 4% said that a wine’s description on the menu is a key driver of wine selections.
Among the “Other” key drivers of wine sales provided, some respondents say that listing the wine style and country of origin is enough for customers to make a decision. Also, the fact that guests understand that “there are no rules for whites and reds” helps them select wines on-premise, according to one survey participant.
Cheers for beer
The IPA trend is far from over, as 67% of respondents to the Cheers/Beverage Information Group 2018 On-premise Survey say that it’s the fastest-growing beer style at their operation. Following the India pale ales, lagers were next, with 6% of respondents ranked in the beer style a fast grower and ales (other than IPAs), pilsners and light beers each had 5%.
Among the “Other” responses for fast-growing beer styles, gose and sour beers ranked highly. Seasonal releases and local brews are also popular.
The best-selling imported beer is Corona, ranked a top seller by 28% of respondents. Belgian brew Stella Artois is second, ranked by 15% of respondents, followed by Heineken with 11%. Further demonstrating the strength of Mexican beers, Dos Equis (7%) and Modelo (5%) round out the top five.
Still, domestic beer represents the highest percentage of beer volume sales—44% on average among survey respondents, compared with 35% for craft and 22% for imports. Draught beer, with an average of 55% of beer sales volume, outweighs bottles and cans of beer with an average of 48% of respondents.
That’s not a big surprise considering that when many guests go out for a beer, they opt for what’s on tap since it’s an experience they can’t replicate at home. It also helps that on-premise operators devote numerous tap handles to different brands and styles of beer.
The Beverage Information Group’s 2018 Cheers On Premise Barometer Handbook is the comprehensive source of information on U.S. on-premise trends. It includes consumption and projection information by category and by market, tracks leading brands and consumer preferences and demographics. The publications can be purchased at Bevinfostore.com or by calling Marybeth Came at 763-383-4400, ext. 2216.